|
|
ADMINISTRATIVE REPORT
Date: April 15, 2002
Author/Local: Don Klimchuk/
604-873-7345
RTS NO. 02509
CC File No. 5560-0/5562
Council: April 30, 2002
TO:
Vancouver City Council
FROM:
General Manager of Engineering Services
SUBJECT:
Update on Recent Regional Transportation Data
INFORMATION
The General Manager of Engineering Services submits this report for INFORMATION.
COUNCIL POLICY
In May 1997, Council adopted the City of Vancouver Transportation Plan, including the mode split targets which emphasize: the need for increased provision and use of transit; limiting overall road capacity to the present level; maintaining an efficient goods movement network; traffic calming in neighbourhoods; and providing more comfortable biking and walking environments.
Policy 3.10.1 of the City of Vancouver Transportation Plan notes "The Engineering and Planning departments will undertake regular monitoring and reviews of transportation services and use, to establish how transportation patterns are developing, and to recommend additional policy measures needed to achieve the Transportation Plan policies and targets."
In June 1999, Council approved recommendations to improve transportation system monitoring, including requesting that the Greater Vancouver Transportation Authority (TransLink) improve regional data collection.
SUMMARY
1) GREATER VANCOUVER TRIP DIARY SURVEY
Data compiled in the 1999 Trip Diary survey represents the travel behaviour of GVRD residents on a typical late fall day. The survey compares the 1999 data to results of a similar survey that was carried out in 1994. Although the results show significant progress being made for meeting City and regional transportation planning objectives in some areas, it also shows other areas where trends moved in the opposite direction.
At the regional level, results show an increase in travel at a rate greater than the population growth rate. Although Auto Driver mode share was held at the same level as 1994, results showing no increase in Transit mode share are of some concern. Also of concern is a slight decrease in car pooling. On the positive side, the results show a slight increase in regional walking and cycling. Also encouraging is a slight reversal in the past trend (1985 to 1994) of significant auto driver and passenger mode share increases for grade school trips.
Contrary to the regional trend, Vancouver results show an increase in travel at a rate under the city's population growth rate. Auto Driver mode share decreased 4% , while similar to the regional results, car pooling decreased slightly. There was virtually no change in Transit mode share. For walking and cycling, there was a significant increase in both mode share (up 6%) and trips (over 100,000 more or a 47% increase). Although the number of walking and cycling trips increased significantly for commuting purposes (up 30%), the largest increase was for Social / Recreational / Personal purposes (up 60%). Most of the change is likely due to City initiatives encouraging people to live close to employment centres, and improvements such as the expansion of Vancouver's bicycle and greenways networks.
For Downtown, Auto Driver and Auto Passenger mode share trends were similar to the results for Vancouver as a whole. However, a decrease in Transit mode share of almost 5% is of concern. The large increase in walking and cycling mode share for Downtown (up 11%), shows that the Downtown was responsible for a significant part of the overall increase for Vancouver. The primary driver for this increase is believed to be the increase in population that took place in the Downtown from 1994 to 1999 (15,000 new residents).
2) UBC TRANSPORTATION DATA REPORT
Transportation mode information specific to the University of British Columbia sub-area, showing trends for the period from 1997 to 2000, was collected using field counts on typical fall days. The results show that Auto Driver mode share remained about the same, while Transit mode share went up about 5%, mostly at the expense of car pooling mode share(down about 6%). Walking and Cycling mode share data showed a slight increase (Note: data was only collected at the entrances to UBC, so trips within UBC were not counted).
PURPOSE
This report provides information summarizing two regional transportation monitoring studies that were released in the Fall of 2001:
1) Greater Vancouver Trip Diary Survey, carried out by TransLink in 1999, and
2) Transportation Data Collection Summary Report, carried out by the University of British Columbia in 2000.These studies highlight areas where it appears that progress is being made in meeting regional and City transportation planning objectives, as well as where there are further challenges.
BACKGROUND
Both the regional and UBC studies were released in the fall of 2001. They provide the most recent information on travel modes and behaviour within the Greater Vancouver region, Vancouver, Downtown and the University of British Columbia (UBC). The Greater Vancouver Trip Diary Survey was carried out by TransLink in 1999. It compares travel data to a similar study that was carried out by the Greater Vancouver Regional District in 1994. The UBC Transportation Data Collection Summary reports on 2000 data specific to UBC, and also compares the results to previous data collected in 1997.
DISCUSSION
1) TRANSLINK GREATER VANCOUVER TRIP DIARY SURVEY (1999)
Travel behaviour data for GVRD residents for a typical fall weekday (October to December) was collected by TransLink in 1999. All household members, 5 years and older, were asked to record their travel patterns over a 24-hour period in a mail-back survey. Approximately 3000 or 60% of the households contacted responded, resulting in a sample size of 0.4% of the GVRD.
Survey results compare both changes in mode volumes and mode splits relative to the last regional trip diary survey, carried out in 1994. In interpreting changes from 1994, it is important to note some differences in the way the 1994 survey was carried out:
· Sampled less than half as many GVRD households, and
· Carried out slightly later in the year (data collection actually extended into January 1995).The Greater Vancouver Trip Diary Survey was reviewed in a TransLink staff report to the TransLink Board in October 2001 (see Appendix A.). Some of the key findings for the five year period from 1994 to 1999 are:
· Population and Employment Growth Slowing
In the region, overall population increased by 10.5% or approximately 180,000 in the 5 year period. This is lower than the growth rate of 14% for the previous 5 years (1989 to 1994). This observation is also confirmed in the GVRD's 2000 Annual Report on the Livable Region Strategic Plan.
Although Vancouver's population growth of 46,900 was one of the highest in the region (in terms of absolute numbers), the highest growth rates in the region were in the Northeast Sector (Coquitlam/Port Moody/Port Coquitlam area).
Employment in the GVRD grew by 9.6% between 1994 and 1999, compared to growth of 11.6% between 1989 and 1994.
· Regional Trips Increasing
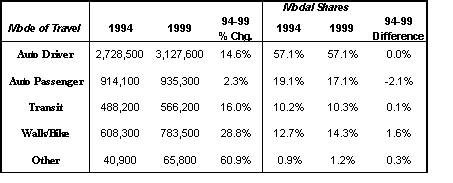
People are travelling more; the total number of trips made by GVRD residents grew by 14.6% while the population grew by 10.6%. Trip growth also outpaced transit supply, which grew by only 10.8%.
· Regional Modes - Car Pooling Down Slightly, Walk/Bike Up Slightly
Daily regional mode shares have mostly held steady, as shown in the table below (Exhibit 4. in the TransLink report). The largest percentage increase in trips has been in Walking/Biking. "Other" mode refers to a mix of taxi, motorcycle and school buses -samples of data for this mode are too small to be statistically significant.
Exhibit 4. Regional 24-Hour Mode Trip Shares, 1994-1999
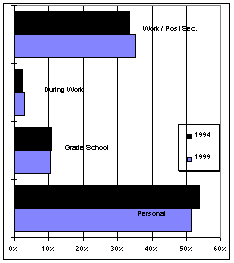
· Commuter Trips Share Up Slightly; Personal Trip Share Down Slightly
As part of the survey, data was collected from residents on their trip purpose. As shown in the table below, commuter (Work / Post Secondary) trips accounted for a third of trips in 1994 and this increased slightly to 35% in 1999. The largest category of trips, Social/Rec./Personal decreased slightly from 53.6% to 51.6%.
Exhibit 9: 24-Hour Purpose and Share of Travel Trip Total, 1994-1999
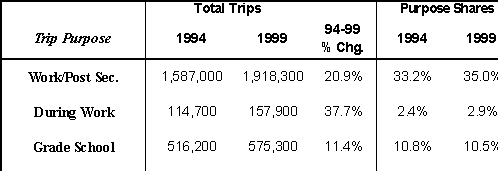
· Past Trend of Regional Grade School Auto Reliance Slowly Reversing
A significant concern that arose in 1994 was a large increase in automobile use for Grade School trips. As shown in the following table and graph, Auto Passenger use for grade school trips has started to decline and Walk/Bike has increased. This positive trend could be partly explained by ICBC sponsored school programs such as "Way to Go", which encourage students to walk or cycle to school, and partly by shifts in demographics.
Exhibit 13: 24-Hour Grade School Trip Shares, 1994-1999
FURTHER DATA - VANCOUVER
Further Trip Diary data specific to Vancouver was obtained from TransLink. When looking at the data for Vancouver and its sub-areas, it should be kept in mind that the accuracy of survey data generally decreases with the size of the area being looked at, as sample sizes get smaller .
· Vancouver Modes - Driving and Car Pooling Down Slightly; Walk/Bike Up
Mode Shares by origin for Vancouver are shown in Table 1. and Figure 1. below.
Figure 1. also provides a comparison with corresponding data for the region.TABLE 1. Vancouver 24-Hour Trip Origin Shares, 1994-1999
Vancouver (All)
Mode
1994
1999
Change
of Travel
Share
Trips
Share
Trips
Trips #
Trips %
Auto Driver
49.9%
746,536
45.9%
714,276
-32,260
-4.3%
Auto Passenger
15.3%
228,376
12.7%
197,429
-30,947
-13.6%
Transit
18.0%
270,026
18.8%
291,777
21,751
8.1%
Walk/Bike
15.2%
227,095
21.5%
334,413
107,318
47.3%
Other/Unknown
1.7%
25,345
1.1%
16,955
-8,390
-33.1%
Total
1,497,378
1,554,851
57473
3.8%
Auto Occupancy
1.31
1.28
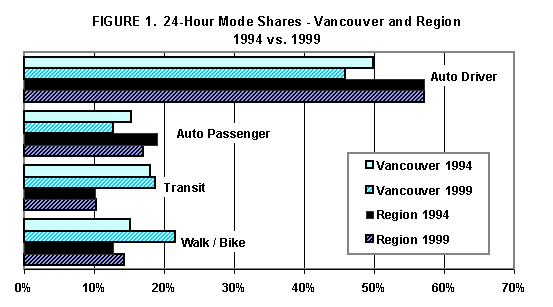
The Trip Diary results above show Vancouver trips increasing by 3.8% in total, while during this period, Vancouver's population grew by 8.9%. Results show Auto Driver trips decreasing 4.3%. City counts of vehicles entering and leaving Vancouver increased about 8% during the same period. This would appear to indicate that the decrease in Auto Driver trips is due to reduced auto use by those living and working in Vancouver. Walk/Bike had by far the largest change in both mode split and number of trips. In comparing this increase to the overall increase in Walk/Bike trips across the region, Vancouver accounted for 58% of the growth. The increase can be attributed to the City encouraging new residential development close to employment centres (e.g. Downtown), and improvements such as the expansion of the City's bicycle and greenway networks.
However, part of the increase might also be attributed to an increased awareness by survey subjects in 1999 of walking and cycling trips. Results of the City's Pedestrian Study, to be carried out later this year, should help confirm the increase in pedestrian trips.
· Vancouver Commuter Trips by Auto Decline; Transit and Walk/Bike Up
As shown in Table 2. below, commuter (Work/Post Secondary) trips by Auto Drivers declined by 6.4%, while shares increased slightly for Transit and Walk/Bike. A much larger Walk/Bike increase (trips up 59.6%) is shown for Social/ Recreational/ Personal purposes. The reason for this significant change could be increased walking and cycling opportunities provided by new bike routes and greenways in the city. Some of the increase may also be attributable to increased reporting of walking and cycling trips. This could be due to increased awareness since 1994, or a misunderstanding by some survey subjects of what constitutes a Social/ Recreational/ Personal trip. For example, there could have been misunderstandings about reporting of walking trips for exercise or dog walking.
TABLE 2. Vancouver 24-Hour Purpose and Share of Origin Travel Trips
Total Trips
Purpose Shares
Trip Purpose
94-99
94-99
1994
1999
% Change
1994
1999
Diff.
Work/Post Sec.
Auto Driver
310,992
288,539
-7.2%
53.7%
47.3%
-6.4%
Auto Passenger
39,553
37,983
-4.0%
6.8%
6.2%
-0.6%
Transit
140,217
167,004
19.1%
24.2%
27.4%
3.2%
Walk/Bike
86,395
111,886
29.5%
14.9%
18.3%
3.4%
TOTAL*
578,791
611,636
5.7%
38.7%
39.2%
0.5%
During Work
44,120
51,265
16.2%
2.9%
3.3%
0.3%
Grade School
116,800
124,626
6.7%
7.8%
8.0%
0.2%
Social/Rec./Per.
Auto Driver
401,874
389,005
-3.2%
53.1%
50.5%
-2.6%
Auto Passenger
140,388
110,999
-20.9%
18.5%
14.4%
-4.1%
Transit
105,392
105,229
-0.2%
13.9%
13.7%
-0.3%
Walk/Bike
99,021
158,059
59.6%
13.1%
20.5%
7.4%
TOTAL*
756,999
772,969
2.1%
50.6%
49.5%
-1.0%
*TOTALS do not sum since "Other" mode omitted for clarity

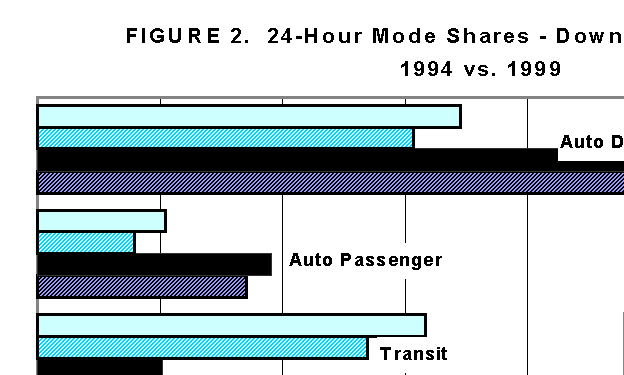
· Downtown Modes - Driving and Transit Decline; Walk/Bike Increases Significantly
Mode Shares by origin for Downtown Vancouver are shown in Table 3. and Figure 2. below. Table 3. does not show data for the number of trips due to the low sample sizes collected in 1994 (changes in the number of trips between 1994 and 1999 cannot be accurately compared). Figure 2. also provides a comparison with corresponding data for the region.
TABLE 3. Downtown 24-Hour Mode Trip Shares, 1994-1999
Downtown |
|||||||
Mode |
1994 |
1999 |
Change |
2021 Targets |
|||
of Travel |
|||||||
Auto Driver |
34.5% |
30.6% |
-3.9% |
36% |
|||
Auto Passenger |
10.4% |
7.9% |
-2.5% |
12% |
|||
Transit |
31.6% |
26.9% |
-4.7% |
34% |
|||
Walk/Bike |
22.0% |
33.2% |
11.2% |
18% |
|||
Total |
n/a |
||||||
Auto Occupancy |
1.3 |
1.26 |
1.33 |
||||
|
|||||||
Similar to the mode results for the whole of Vancouver, Auto Driver and Auto Passenger mode shares for the Downtown decreased slightly. Of concern is that Downtown transit mode share decreased about 5%. More positively, Walk/Bike mode share increased significantly (up by 11%.) . The substantial increase in this mode can be partly explained by the increase in population in the downtown between 1994 and 1999 (grew by 15,000). 1996 census data showed that people living downtown walk significantly more than in other areas of the city or the region. As noted previously, there may also be some over estimation of the magnitude of the increase in the Walk/Bike mode in the Trip Diary survey.
· Comparison to Transportation Plan Targets
Table 3. also provides a comparison of the 1994-1999 Trip Diary Survey Results to the City's 1997 Transportation Plan targets (Section 2.5) for the Downtown . The Plan sets Mode targets for 2021, in terms of mode percentages and volumes, for the City as well as the sub-areas of Downtown, Central Broadway and Rest of City. Progress towards Transportation Plan targets for the downtown can be summarized as follows for the 1999 Trip Diary mode shares:
· Auto Driver is better than target, with trend showing improvement;
· Auto Passenger is below target, with trend showing decline;
· Transit is below target, with trend showing decline; and
· Walk/Bike is better than target, with trend showing improvement.
2) UBC DATA COLLECTION SUMMARY REPORT (2001)
The University of British Columbia (UBC) also recently reported on transportation monitoring results. In October 2001, the UBC Trek Program Centre at the UBC released a Transportation Data Collection Summary report covering typical fall days in the period between 1997 and 2000. The Summary section of this report is attached as Appendix B. The full report (35 pages) is on file with the City Clerk's Office and is also available from the UBC Trek website (http://www.trek.ubc.ca).
Information in the report that is of most interest to Vancouver is the data on mode shares over a 24-hour period. The City's Transportation Plan identified UBC and the University Endowment Lands (UEL) as being the city's largest traffic generator after the Downtown. Accordingly, the City's Transportation Plan includes targets for UBC/UEL even though this sub-area is outside the municipal boundary for the City.
The report notes that since travel data is collected over a short period each year, daily fluctuations can be expected to account for variations in travel numbers of 5% to 10%. Some further discussion on study accuracy is noted below in the section titled "Comparison to TransLink Trip Diary Survey"
The total number of person trips at UBC are reported as increasing by only 1% between 1997 and 2000, while staff, faculty and students during this period increased by about 6%. Estimated 24-Hour mode shares crossing the screen-line into the UBC campus are shown in Table 4. below.
Table. 4. UBC 24-Hour Mode Trips Shares, 1997-2000
Mode
|
1997 |
2000 |
Change |
2021 Targets** | |||
Share |
Trips |
Share |
Trips |
Trips |
Share | ||
Auto Driver |
43.3% |
46,000 |
44.2% |
47,200 |
1,200 |
41% | |
Auto Passenger |
34.1% |
36,200 |
27.7% |
29,600 |
-6,600 |
16% | |
Transit |
17.9% |
19,000 |
22.8% |
24,300 |
5,300 |
33% | |
Walk/Bike |
3.9% |
4,100 |
4.5% |
4,800 |
700 |
10% | |
Total* |
106,175 |
106,775 |
600 |
||||
Auto |
1.32 |
1.26 |
1.39 | ||||
* Totals do not sum since "Other" mode has not been shown for clarity ** Transportation Plan targets are for both UBC and UEL |
|||||||
· UBC Car-Pooling Decreases
Auto Passenger or car-pooling mode share decreased by about 6% and the number of trips decreased about 18%. As shown in the Greater Vancouver Trip Diary Survey, the trend in the region has also been towards slightly lower levels of car-pooling. In the case of UBC, the report notes that UBC commuters appear to have shifted from car pools and van pools to public transit (see next bullet for transit trend).
· UBC Transit Trips Increase
UBC mode share for transit increased about 5% and the number of trips increased by about 28%. The increase in transit use is attributed to an increase in transit service by BC Transit / TransLink of 30% during this time period.
· UBC Walking and Cycling Trips Up
UBC mode share for the Walk/Bike mode increased slightly across the UBC screenline locations. Of the estimated 700 additional trips made by these modes in a 24-hour period, 200 were attributed to walking and 500 were attributed to cycling. The report attributes the cycling increase, in part, to bicycle lane improvements made to University Boulevard, and the walking increase, in part, to up to 200 vehicles a day parked on the UEL portion of W. 16th Avenue (majority being UBC students avoiding pay parking on campus).
· Comparison to Transportation Plan Targets
Table 4. also provides a comparison of the UBC results to the City's 1997 Transportation Plan 2021 targets. Although the Transportation Plan target includes both UBC and the UEL, the majority of travel in this area is generated by UBC.
Progress towards Transportation Plan targets for UBC can be summarized as follows for the 1999 Trip Diary mode shares:
· Auto Driver exceeds target , with trend showing increase;
· Auto Passenger is above target, with trend showing decrease;
· Transit is below target, with trend showing increase; and
· Walk/Bike results for the UBC study show a positive trend, but are not comparable to the Transportation Plan target because of differences in the way the UBC data was derived (see next bullet for explanation).
· Comparison to TransLink Trip Diary Survey
Mode share data obtained from TransLink for the UBC/UEL sub-area produced similar results for most modes, as shown below:
Mode of Travel UBC TransLink -UBC/UEL
(2000) (1999)
Auto Driver 44% 44%
Auto Passenger 28% n/a*
Transit 23% 24%
Walk/Bike 5% 19%
* sample size too small to give a reliable number
TransLink's trip diary indicated Auto Driver and Transit mode shares that were roughly the same. However, the Trip Diary results for the Walk/Bike mode was substantially higher (19% versus 5%). This can be explained by the screen line method used by the UBC study - although this method is accurate in estimating mode share for longer trips (auto and transit), it misses short trips made by walking and bicycling inside the screenline area (i.e. within the UBC Campus). These shorter trips make up a significant number of trips for the cycling and walking modes. The UBC methodology also excludes comparison to the City's Transportation Plan targets for the Walk/Bike mode.
CONCLUSION
A key strategy in Vancouver's Transportation Plan is to accommodate growth in transportation demand through transit, walking and biking. The Greater Vancouver Trip Diary Survey shows that between 1994 and 1999, success was achieved in some key areas. Travel within Vancouver increased at a slower rate than the rate of population growth. Single occupant automobile use in both the city as a whole and Downtown decreased slightly, while significant increases in walking and cycling modes occurred.
Data from the UBC Transportation Data Collection Summary also shows positive trends for the UBC sub-area with a significant increase in transit mode share. The UBC report attributes the increase in Transit mode share primarily to a significant increase in transit service that occurred at the same time.
Working against the City's Transportation Plan objectives are trends shown in the Trip Diary Survey for both transit and car pooling. The Survey showed car pooling decreased slightly for both Vancouver and the Downtown, when Plan targets for 2021 call for an increase. Of greater concern relative to Plan targets, is the data showing lack of any significant transit mode growth in the city, and a drop in transit mode share in the Downtown of almost 5%.
Relative to the Greater Vancouver region, Vancouver had more success in slowing its rate of travel increase and improving its walking and cycling mode shares. Contrasting the results for Vancouver, regional Trip Diary results show an increase in travel at a rate greater than the population growth rate. While walking and cycling mode share increased by over 6% in Vancouver, regionally the increase was less than 2%.
* * * * *
![[City Homepage]](/graphics/footnava.gif)
|
![[Get In Touch]](/graphics/footnavb.gif)
|

|

|

|
(c) 1998 City of Vancouver