|
CITY OF VANCOUVER ADMINISTRATIVE REPORT | |||
Date: |
March 23, 2004 | |||
Author: |
Don Klimchuk | |||
Phone No.: |
873-7345 | |||
RTS No.: |
04089 | |||
CC File No.: |
5551 | |||
Meeting Date: |
April 6, 2004 | |||
TO: |
Standing Committee on Transportation and Traffic |
FROM: |
General Manager of Engineering Services |
SUBJECT: |
2003 Transit Ridership Data |
INFORMATION
The General Manager of Engineering Services submits this report for INFORMATION.
COUNCIL POLICY
In May 1997, Council adopted the City of Vancouver Transportation Plan, including the mode split targets which emphasize the need for increased provision and use of transit.
In June 1999, Council approved recommendations to improve transportation system monitoring, including requesting that the Greater Vancouver Transportation Authority (TransLink) improve regional data collection.
In July 2002, Council approved the Downtown Vancouver Transportation Plan, which emphasizes a balanced transportation system that includes enhanced public transit.
SUMMARY
Accommodating growth in transportation demand through increased public transit use is a key strategy in both Vancouver and regional transportation plans. Two recent reports, one from TransLink and the other from the University of British Columbia Trek Program, indicate significant increases in transit ridership both regionally and locally.
TransLink's report notes that total transit ridership increased almost 12% between 2002 and 2003. This represents the strongest growth in transit ridership in the region since the Expo SkyTrain line opened in 1986. A number of initiatives contributed to this increase, including the opening of the Millennium SkyTrain line, bus service improvements, introduction of U-Pass Programs, increased sale of monthly transit passes and recovery from the impacts of the 2001 transit strike. Related data from TransLink also shows that although Vancouver represents only about 27% of the region's population, it continues to account for over 50% of the region's transit ridership.
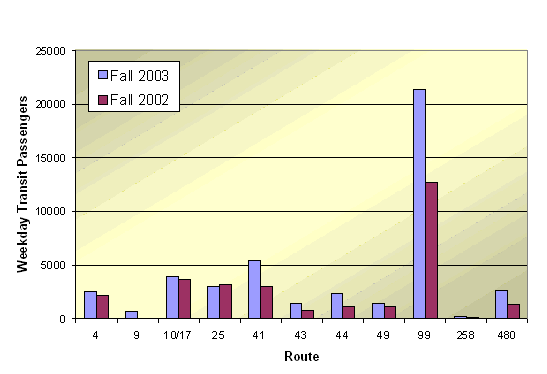
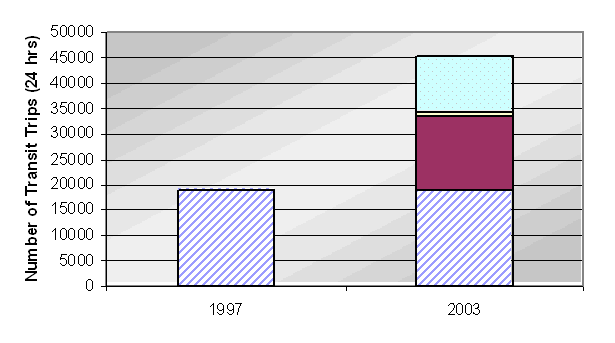
The UBC Trek Program report highlights the significant contribution that the UBC U-Pass had towards increasing regional transit ridership. This program was introduced in Fall 2003. Compared to 2002 levels, U-Pass generated a transit ridership increase to and from UBC of almost 16,000 trips per day (53% increase). Much of the increase in transit ridership was a result of a reduction in car-pooling. Progress was shown with reducing single-occupant vehicle (SOV) use generated by the campus. Compared to 1997 levels, SOV use decreased 2.2% - although this reduction is small, it is a significant trend given that the daytime population at UBC grew 20% during this period. UBC also reported a 7% decrease in daily traffic volumes on the arterials leading to the campus.
PURPOSE
The purpose of this report is to provide an information update on transit ridership trends (including the impact of U-pass implementation), based on data that was collected by TransLink and the University of British Columbia in 2003.
BACKGROUND
Providing for growth in transportation demand through increased public transit use is a key strategy in both Vancouver and regional transportation plans. TransLink (the Greater Vancouver Transportation Authority) as part of its mandate for delivering transit services to the region, regularly monitors and reports on estimated transit ridership. On a monthly basis, the number of system users is estimated from fare box revenues. This ridership information is broken down by main transit modes: bus, SkyTrain, SeaBus and West Coast Express. After the end of each year, the monthly data is totalled and annual ridership is reported.
These annual reports provide important indicators on how the City and region are progressing towards meeting their transportation objectives. Although trip diary surveys carried out by the region provide more detailed data on transit trips and other mode shares, these surveys are carried out on a 5-year cycle (with the most recent being in 1999). Annual transit ridership estimates are therefore important for tracking transit trends between years in which trip diary surveys are carried out.
The University of British Columbia (UBC) also collects transit and other mode share data on an annual basis. Monitoring is carried out through the UBC TREK Program Centre, to track progress towards their commitment to reduce UBC single occupancy vehicle trips by improving transportation choices. Vancouver's Transportation Plan (1997) recognized that
next to downtown, UBC is the City's largest generator of trips. The Plan sets transit and other 2021 mode share targets for the both the City as a whole, and important sub-areas such as UBC.
One of the main strategies for helping to reach UBC's transportation objectives has been to develop a universal discounted transit pass for students (U-Pass), in partnership with TransLink. A U-Pass program for UBC was implemented by TransLink, UBC, and the Alma Mater Society (student governing body) in September 2003, and included increasing transit service on routes serving the university. The U-Pass is mandatory for all AMS students and provides unlimited student access to TransLink bus, SkyTrain and SeaBus services during the school year. U-Pass holders are also eligible for discounted West Coast Express fares. Current U-Passes will expire at the end of April 2004. The 2004/2005 school year U-Passes will come into effect in mid-August 2004. UBC has begun discussions with TransLink on the possibility of implementing a summer U-Pass in 2005.
DISCUSSION
The reports from TransLink and the UBC Trek Program that are summarized below, provide updates on local and regional transit ridership trends. Besides indicating progress towards transportation planning objectives, the reports also provide important context for the upcoming Vancouver Transit Area Plan.
1) TRANSLINK 2003 TRANSIT RIDERSHIP REPORT (February 2004)
TransLink's 2003 Transit Ridership report was made to the GVTA Board of Directors at their February 25th, 2004 meeting. The full report (4 pages) can be viewed on-line at http://www.translink.bc.ca/Boards_and_Committees/. Some of the key changes from 2002 to 2003, on a region-wide basis are:
Total Transit - up 11.7%
The total transit ridership increase in 2003 was the strongest growth in the region since the Expo SkyTrain line opened in 1986. TransLink attributes this to a number of factors including:
· Opening of the Millennium SkyTrain line and related bus connection improvements in September 2002
· Improving other bus service, including increased B-line service and improved frequency on other busy routes
· Introducing U-Pass Programs at UBC and Simon Fraser University (Burnaby campus). In the Fall of 2003, U-Passes represented 7% of all transit trips. It was estimated that about one-third of the U-Pass trips were new trips made by students for travel to campus and for other purposes. The U-Pass program is very popular, with usage exceeding expectations.
· Increasing the proportion of customers purchasing monthly passes and using them to take more transit trips. Customer trips using monthly passes increased from 41% in 2002 to 44% in 2003. This was felt to be due mainly to monthly pass prices being exempted from the fare increase in 2002 and the resulting savings they offer over cash or tickets.
· Fully recovering from the impact of the 2001 transit strike and 2002 fare increase for cash and tickets.
Bus - up 11.2%
This increase was significantly higher than forecast. Although bus ridership increased in all parts of the region, the largest percentage growth was in Vancouver, Burnaby, Richmond and other South of Fraser areas.
SkyTrain - up 15.1%
In addition to the opening of the Millennium Line in Fall 2002, the passenger capacity of the Expo Line was increased as 60 new Mark II cars were phased into service. Fall 2003 ridership on the Millennium Line was 20% higher than Fall 2002, with passenger boardings approaching the 49,000 level forecast by TransLink in 2001.
SeaBus - down 1.5%
The slight decrease in ridership was attributed to the regional slowdown in tourism and international education.
West Coast Express - no change
Although some ridership loss was forecast due to competition with the opening of the Millennium Line and #97 B-Line bus service, it has been very small and less than anticipated.
2) ADDITIONAL BUS RIDERSHIP DATA - VANCOUVER
In addition to the regional data in TransLink's Board report, staff obtained extra bus and SkyTrain data from TransLink that is more specific to Vancouver.
Vancouver Bus - Up over 9%; over half of system ridership is Vancouver based
With the methodology used for bus ridership data collection, it is not possible to precisely separate only the ridership for routes in Vancouver. However, a reasonable estimate of bus ridership trends in Vancouver can be obtained by reviewing data for the Oakridge Transit Centre, which serves most Vancouver routes. This data is shown in Table 1. below.
Table 1. Oakridge Transit Centre Bus Ridership
2002 |
2003 |
2003 |
02-03 |
|
|
% of Regional |
Increase |
46,426,000 |
50,611,000 |
52% |
9% |
Although the Oakridge Transit Centre data includes most Vancouver routes, two of the busiest routes in the city (and region), the #98 and #99 B-Lines, are not included since they run from transit centres in other municipalities. Accordingly, Vancouver's total transit ridership is somewhat higher than indicated by just the Oakridge Transit Centre data. Although it is not possible to separate the Vancouver B-line data from other transit centres, TransLink has collected data on average Vancouver B-Line boardings on weekdays, which is shown in Table 2. below. Total Boardings cover all passenger boardings along the entire length of the B-Line service (i.e. from Commercial Drive to UBC on the #99).
Table 2. Vancouver B-Line Total Boardings on a Weekday
|
2002 |
2003 |
02-03 |
|
|
|
Increase |
#98 B-Line (Granville) |
18,000 |
20,000 |
11% |
#99 B-Line (Broadway) |
25,000 |
34,000 |
36% |
Total |
43,000 |
54,000 |
26% |
As noted previously, the large increase in the #99-B-Line boardings can be attributed mostly to the introduction of the UBC U-Pass.
Vancouver SkyTrain - Up 13.9%
A further breakdown of the regional SkyTrain data for Vancouver station ridership is shown in Table 3. below. The overall increase in SkyTrain ridership in Vancouver of about 14% is similar to the SkyTrain growth in the region as a whole. The 27% drop in ridership at the Broadway Station can be attributed to some ridership being transferred to the Commercial Station with the opening of the Millennium Line. Similar to bus ridership, Vancouver users account for over 50% of the ridership on SkyTrain.
Table 3. Vancouver SkyTrain Ridership (Revenue Passengers)
STATION |
2002 |
2003 |
CHANGE |
|
| ||
Expo Line |
| ||
WATERFRONT |
693,751 |
696,055 |
0.3% |
BURRARD |
2,464,645 |
2,764,273 |
12.2% |
GRANVILLE |
2,604,694 |
2,754,064 |
5.7% |
STADIUM |
1,723,138 |
1,853,318 |
7.6% |
MAIN STREET |
1,340,744 |
1,450,688 |
8.2% |
BROADWAY |
1,835,286 |
1,333,577 |
-27.3% |
NANAIMO |
825,150 |
886,349 |
7.4% |
29TH AVENUE |
707,001 |
755,947 |
6.9% |
JOYCE |
1,467,495 |
1,553,912 |
5.9% |
Sub-total |
13,661,903 |
14,048,182 |
2.8% |
|
| ||
Millennium Line |
| ||
RUPERT |
90,256 |
319,205 |
N/A* |
RENFREW |
95,091 |
334,123 |
N/A* |
COMMERCIAL |
389,160 |
1,520,434 |
N/A* |
Sub-total |
574,507 |
2,173,761 |
|
|
| ||
Vancouver Total |
14,236,409 |
16,221,944 |
13.9% |
|
Vancouver % of Region |
51.7% |
52.1% |
|
|
| ||
Region Total |
29,448,779 |
33,897,781 |
15.1% |
* Annual comparison not applicable since Millennium Line did not open until Fall 2002


